
Hepatocyte Stability Assay
Understand the metabolism of your compounds by using our hepatocyte stability assay to measure in vitro intrinsic clearance or to identify metabolites formed.
The hepatocyte stability assay is one of our portfolio of in vitro ADME screening services. Cyprotex delivers consistent, high quality data with cost-efficiency that comes from a highly automated approach.
Introduction
Measurement of in vitro intrinsic clearance using hepatocytes:
- The liver is the most important site of drug metabolism in the body. Approximately 60% of marketed compounds are cleared by hepatic CYP-mediated metabolism1.
- Hepatocytes contain the full complement of hepatic drug metabolizing enzymes (both Phase I and Phase II) maintained within the intact cell.
- Hepatocytes can be used to determine the in vitro intrinsic clearance of a compound.
- The use of species-specific cryopreserved hepatocytes can be used to enable an understanding of interspecies differences.
- Hepatocytes can be used to profile for metabolites formed by both Phase I and Phase II enzymes.
Protocol
Hepatocyte Stability Assay Protocol
Follow on metabolite profiling and structural elucidation
Cyprotex's hepatocyte stability assay can be extended to profile the metabolites that are formed. Cyprotex’s biotransformation services are supported by high-resolution, accurate mass spectrometry. These services can provide information on an individual species’ metabolite profile, or a cross-species comparison to identify potential differences in metabolism which could in turn help to interpret pharmacology and toxicity data. Structural elucidation can also be performed on the potential metabolites’ MS/MS fragmentation data. All biotransformation studies are performed by a dedicated team of experts.
Please refer to our Metabolite Profiling and Identification section for further details.
Data
Data from Cyprotex's Hepatocyte Stability Assay
Q&A
Please provide an overview of Cyprotex's hepatocyte stability assay.
The hepatocytes are incubated with the test compound at 37°C. Samples are removed at the appropriate time points into acetonitrile to terminate the reaction. Following centrifugation, internal standard is added and the supernatant is analysed by LC-MS/MS. The disappearance of test compound is monitored over a 60 or 120 minute time period. An example of a typical depletion profile is shown in Figure 3.
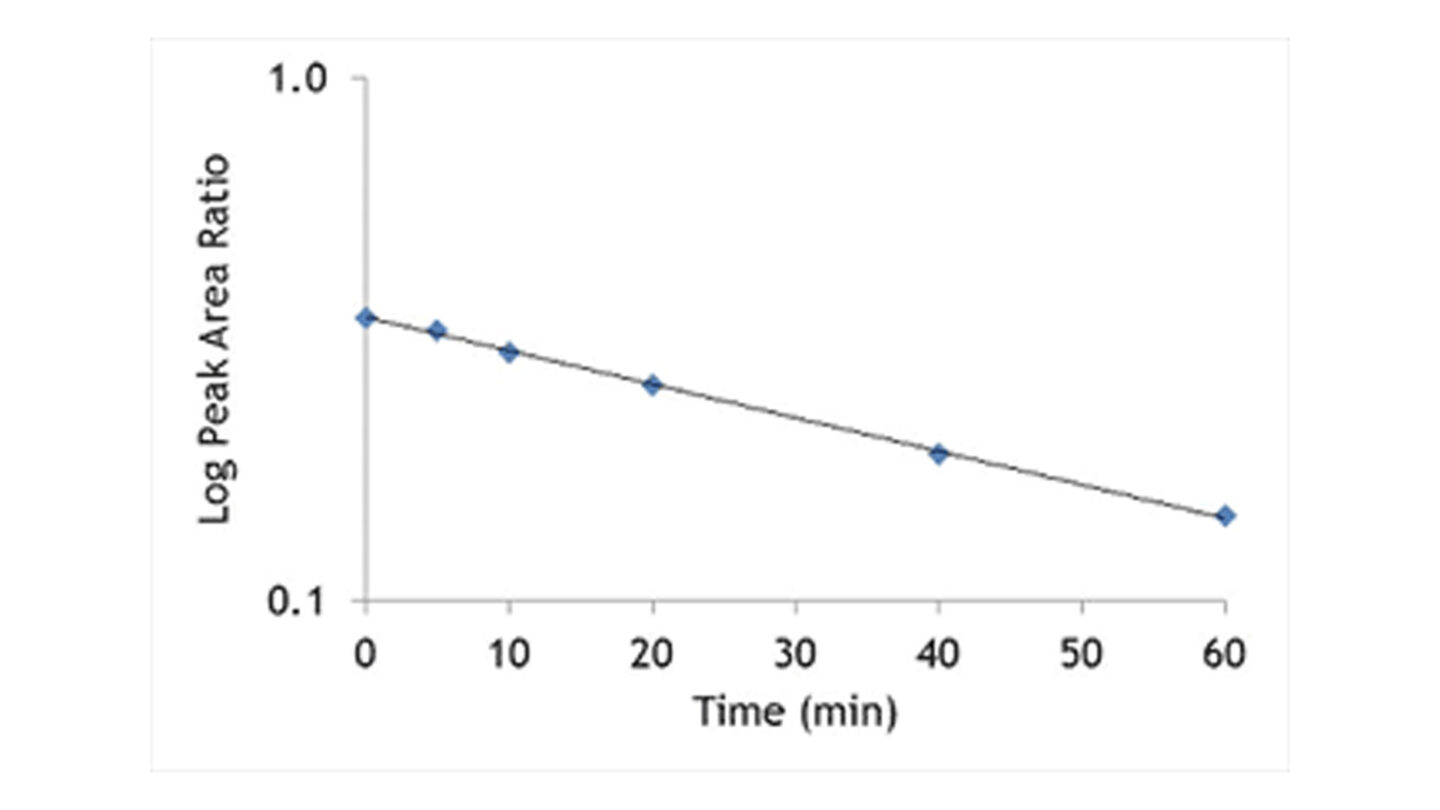
Figure 3
Graph shows test compound disappearance with time in the presence of hepatocytes.
The ln peak area ratio (compound peak area/internal standard peak area) is plotted against time and the gradient of the line determined.
What are the benefits of using hepatocytes for drug metabolism studies?
The liver is the main organ of drug metabolism in the body. Hepatocytes contain both Phase I and Phase II drug metabolizing enzymes, which are present in the intact cell, and provide a valuable in vitro model for predicting in vivo hepatic clearance.
How do you overcome the problems with inter individual variability in humans?
Cyprotex's hepatocyte stability assay uses cells pooled from a minimum of three different individual donors both male and female. This reduces the problems associated with inter individual variation in drug metabolism.
What is the difference between qualified and calculated CLint value?
Calculated CLint is the actual CLint value based on the half life obtained in the hepatocyte stability assay. The qualified CLint value takes into account the lower limit of quantification for the assay when the half life for a test compound exceeds 3* the assay duration. This half life corresponds to approximately 20% compound disappearance at the last assay timepoint. The CLint values associated with this half life will differ depending on the cell density used in the incubation (see equation above). Where compound disappearance is <20% over the time course then this may be due to analytical variability and further work may be required to ensure the result is reproducible. Where the calculated CLint is close to the LoQ for the assay then repeating the assay could help to confirm the result. Alternatively depending on the assay conditions used it may be possible to extend the incubation time (max 2hr for suspension hepatocytes) or use the low clearance assay (HµRELhumanPoolTM co-culture 72hr incubation) to achieve greater sensitivity.
How do I interpret the data from the hepatocyte stability assay?
Scaling and in vitro - in vivo extrapolation of clearance:
In vivo hepatic clearance can be predicted from in vitro CLint using the well stirred model5. In vitro CLint values are scaled to an in vivo CLint value using species-specific hepatocellularity values that relate the number of hepatocytes in a whole liver, to those in the assay and correcting for nonspecific binding in the assay (fuinc)4. This in vivo CLint can then be used to predict in vivo hepatic clearance by taking into account the free fraction in blood and liver blood flow.
where:
CLint = intrinsic clearance (mL/min/kg)
CLh = hepatic clearance (mL/min/kg)
Qh = liver blood flow (mL/min/kg)
SF = Species dependent Hepatocyte Scaling factor
fub = Fraction unbound in blood (if unknown can assume = 1)
fuinc = Fraction unbound in the incubation (if unknown can assume = 1)
Application of this approach for a set of marketed compounds is shown in Figure 1. CLint data was generated in the human hepatocyte stability assay and scaled to a predicted in vivo intrinsic clearance using literature values for fub, fuinc, Qh and scaling factors. Demonstrating that predicted hepatic clearance in preclinical species correlates well with measured in vivo clearance for the test compound builds confidence that clearance is predominantly hepatic and that human CLint is predictive of in vivo CLh.
Rank order and clearance categories.
One of the main uses of hepatocytes stability data is that compounds can be ranked in terms of their intrinsic clearance values.
Classification bands can be used to categorise compounds into low, medium or high clearance. These classification bands are calculated from a rearrangement of the well stirred model5 detailed in the following equation assuming extraction ratios of 0.3 and 0.7 (the fraction of drug which is eliminated from the blood by an organ) for the low and high boundaries respectively. This can be scaled to intrinsic clearance (µL/min/106 cells) using the relevant liver weights3 and hepatocellularity2,6. Due to lack of literature information the monkey hepatocellularity was assumed to be 120x106 cell/g liver. For simplicity fu has been assumed to be 1, this represents the worse case scenario and where compounds are more highly plasma protein bound less stringent criteria would apply.
where:
CLh = hepatic Clearance (mL/min/kg)
Qh = liver blood flow (mL/min/kg)
E = Extraction ratio
fu = fraction unbound in plasma (assumed at 1)
where:
CLH = E x QH
QH = liver blood flow (mL/min/kg)5
E = Extraction Ratio
CLH = Hepatic Clearance (mL/min/kg)
fu = fraction unbound in plasma (assumed at 1)
What stage in the drug discovery process does the hepatocyte stability assay tend to be used?
Clients tend to use the microsomal stability assay as a primary screen early in the drug discovery process. The hepatocyte stability assay is then used as a secondary screen for the more favourable compounds from the primary screening.
What may cause differences in the rates of clearance obtained from hepatocyte and microsomal assays?
Compounds that do not readily permeate cell membranes or are subject to efflux may appear to be more stable in hepatocyte incubations than in microsomal incubations. Compounds that undergo Phase II metabolism may appear less stable in hepatocyte compared to microsomal incubations.
References
1) LeCluyse EL and Alexandre E (2010) Isolation and culture of primary hepatocytes from resected human liver tissue. Methods Mol Biol 640; 57-82
2) Barter ZE et al. (2007) Scaling factors for the extrapolation of in vivo metabolic drug clearance from in vitro data: reaching a consensus on values of human microsomal protein and hepatocellularity per gram of liver. Curr Drug Metab 8(1); 33-45
3) Davies B. and Morris T. (1993) Physiological parameters in laboratory animals and humans. Pharma Res 10(7); 1093-1095
4) Riley RJ et al. (2005) A unified model for predicting human hepatic, metabolic clearance from in vitro intrinsic clearance data in hepatocytes and microsomes. Drug Metab Dispos 33(9); 1304-1311
5) Houston JB. (1994) Utility of in vitro drug metabolism data in predicting in vivo metabolic clearance. Biochem Pharmacol 47(9); 1469-1479
6) Sohlenius-Sternbeck AK (2006) Determination of the hepatocellularity number for human, dog, rabbit, rat and mouse livers from protein concentration measurements. Toxicol. In Vitro 20; 1582-1586
Downloads
Contact Our Experts