
CellCiphr® Premier
Introduction
- Hepatotoxicity is one of the main reasons for drug withdrawals, accounting for 37% of all therapeutics taken off the market between 1994 and 20061.
- CellCiphr® Premier is a cell-based assay that combines an extended panel of toxicologically-relevant endpoints with Cyprotex’s CellCiphr® classifier to provide one of the most reliable clinical hepatotoxicity predictors available (sensitivity = 70% and specificity = 100%).
- Both HepG2 (replicating cells) and primary rat hepatocytes (metabolically competent cells) are investigated at multiple time points (extending from 4 hrs to 5 days to identify early and late stage toxic effects).
- The data can be integrated with actual or predicted Cmax to correct for exposure-related effects.
- The extended panel of end points allows CellCiphr® Premier to offer enhanced predictivity for hepatotoxicity risk over the standard CellCiphr® panels.
Protocol
CellCiphr® Premier Profiling Protocol
Data
Data from CellCiphr® Premier
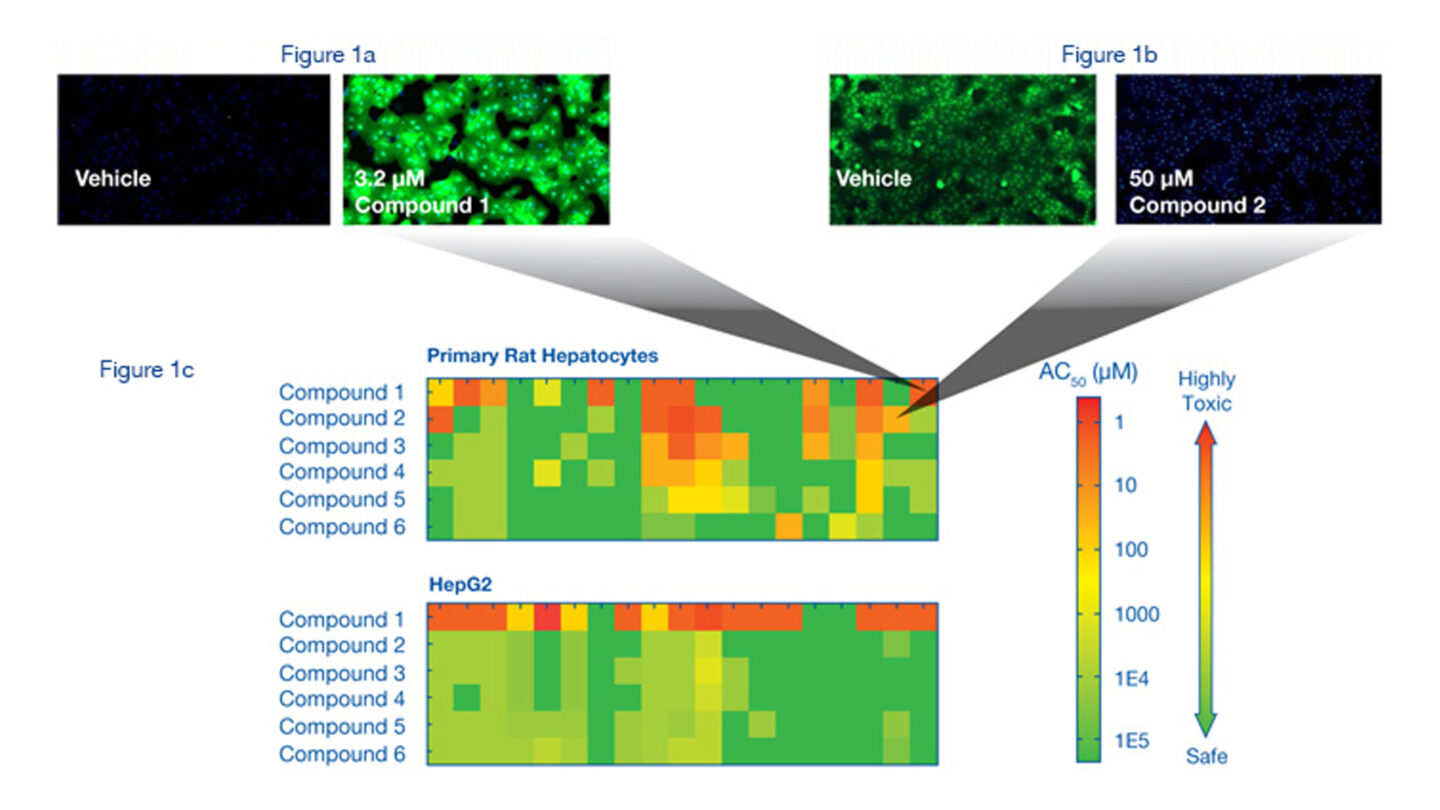
Figure 1a
Reactive Oxygen Species (ROS) Assay. Rat hepatocytes were stained with Hoechst and CM-H2DCFDA after 4 hour incubation with vehicle (DMSO) or Compound 1, which induces ROS. CM-H2DCFDA enters the cell and reacts with ROS to create a fluorescent signal. ROS levels were determined using the ArrayScan® VTI.
Figure 1b
Glutathione (GSH) Assay. Rat hepatocytes were stained with Hoechst and monochlorobimane after 18 hour incubation with vehicle (DMSO) or Compound 2, which depletes GSH. Monochlorobimane reacts with cellular GSH. GSH levels were determined in the cytoplasm of the cells using the ArrayScan® VTI.
Figure 1c
Representative heat maps for CellCiphr® Premier. The heatmaps demonstrate the pattern of endpoint response for the six compounds in a set. The AC50 of the endpoint response is shown using a colour scale from red (highly toxic) to green (safe) with the bar at the right showing the full range of the AC50 scale. The heatmaps demonstrate various biomarkers at different time points giving rise to a ‘toxicity risk fingerprint’ for each compound. These data can be used to determine the mechanistic pathways causing the toxic response and the time course over which it occurs. The AC50 data from the different endpoints, for example GSH and ROS activity, are represented by specific boxes on the heatmaps, as demonstrated by the grey connectors that link to the detailed images shown in Figures 1a and 1b.
References
1) Dykens JA and Will Y (2007) Drug Discovery Today 12; 777-785
2) Zanella F et al., (2010) Trends Biotechnol 28(5); 237-245
3) Xu JJ et al., (2008) Toxicol Sci 105(1); 97-105
Contact Our Experts